Par Luís Santos-Pinto
Article rédigé le 8 mai 2020
To respond to the covid-19 epidemic most countries are currently applying what Puyeo (2020a) calls “the hammer and the dance.” This strategy consists in lockdowns and harsh social distancing measures to stop the spread of the virus (“the hammer”), followed by testing, contact tracing, and isolation in order to manage the epidemic by keeping the effective reproduction number below 1 (“the dance”). This strategy minimizes the number of fatalities and injuries and hopefully buys enough time for a treatment or a vaccine to be found.
This article focuses on 9 western countries–Switzerland, Germany, Spain, Portugal, Italy, France, UK, Sweden, and US–and assesses which of them are ready to dance. The article uses two criteria to perform this assessment:
- The evolution of new confirmed cases in previous week and total confirmed cases
- The evolution of daily new tests and daily new cases
The article argues that these 9 countries can be assigned to three different groups:
Group 1: Countries in this group perform well in both criteria. In other words, these countries have a small number of daily new cases, and are doing enough tests to detect new cases. Countries in this group are ready to “dance.” Switzerland and Germany belong to this group.
Group 2: Countries in this group perform well in one criteria. These countries are not yet ready to “dance” because the number of daily new cases is still relatively high. However, these countries are doing enough tests to detect cases. Countries in this group should apply “the hammer” for a couple more weeks and then enter the “dance.” Portugal, Spain, Italy, and France belong to this group.
Group 3: Countries in this group perform poorly in both criteria. These countries are not ready to “dance” because the number of daily new cases is not far from the apex. In addition, these countries are not doing enough tests to detect cases. Countries in this group should apply the “hammer” for at least one more month. They also need to use the increased lockdown time to raise their testing capabilities to be able to “dance.” The UK, Sweden, and the US belong to this group.
The article also provides estimates for the transition dates for each country. That is, the moment when each country can leave “the hammer” and enter “the dance.” Finally, the article provides estimates for the case fatality rate (CFR) and the infection fatality rate (IFR) at the transition date for all countries–except the UK for lack of data. The IFR is estimated to be one-tenth of the CFR based on the assumption that for each confirmed case there are ten undetected ones. This assumption is likely to hold on average but there might be substantial variation across countries.
A few days before finishing the article, it is clear that the US has opted for abandoning the “hammer” without satisfying the necessary conditions to “dance.” Hence, the predictions for the US will most likely end up very far from the actual outcomes. Nevertheless, they are included here.
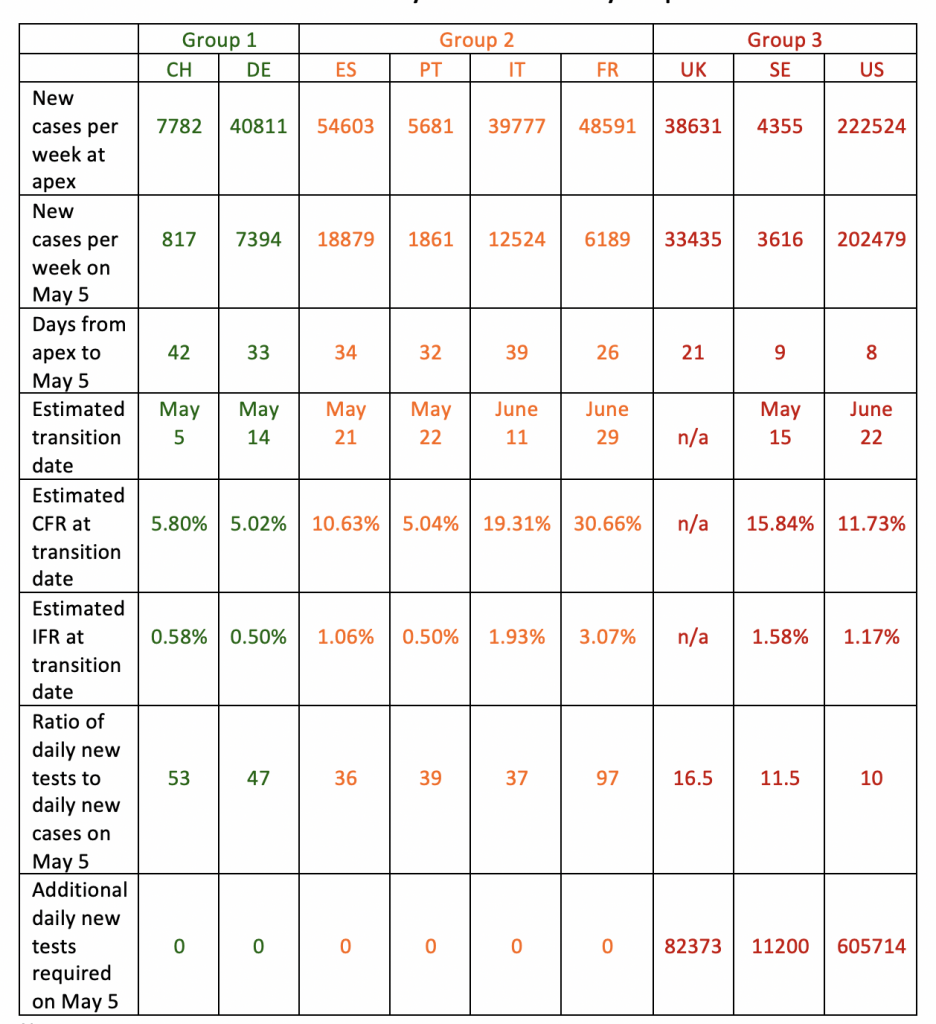
Table 1 summarizes the findings of the article.
Table 1: Summary of Covid-19 Country Comparison
Notes:
(1) The data is taken from https://www.worldometers.info/coronavirus/
(2) “Days from apex to May 5” is the number of days elapsed between the peak in weekly cases and May 5.
(3) The “Estimated transition date” is the date when a country can move from “the hammer” to the “dance.” The “Estimated transition date” and the “Estimated CFR at transition date” are obtained as the interception of the fitted trend for the Closed CFR with the fitted trend for the All-in CFR.
(4) The “Estimated IFR at transition date” is obtained by dividing the “Estimated CFR at transition date” by 10 (this assumes that the number of cases is 10 times greater than the number confirmed cases).
Switzerland
Figure 1
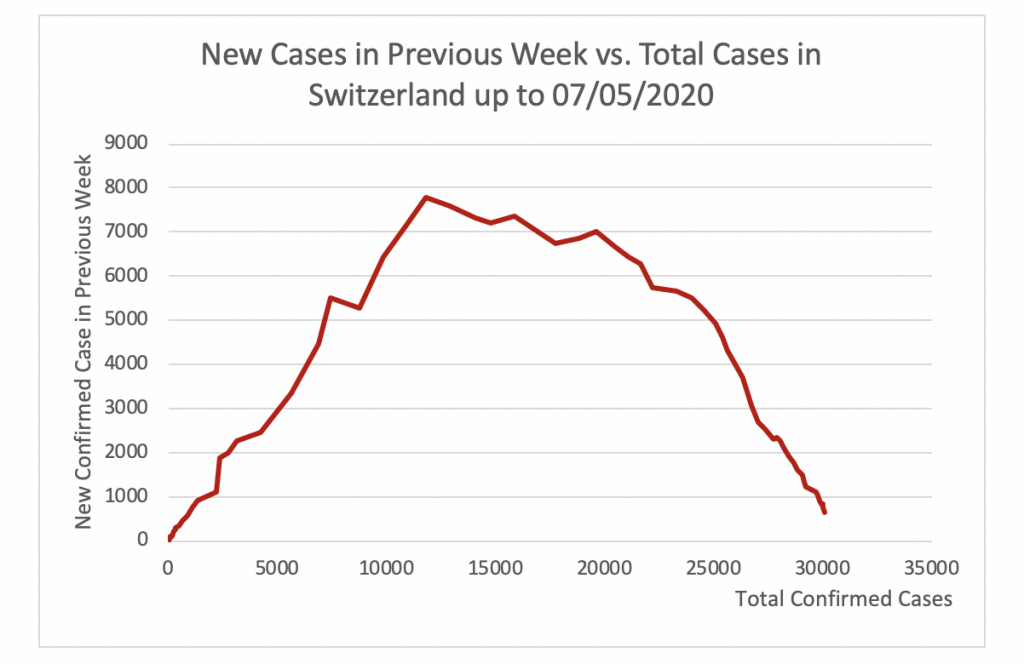
Figure 1 displays the evolution of total confirmed cases (horizontal axis) and new confirmed cases in the previous week (vertical axis) in Switzerland since the 100th confirmed case. It shows that the apex of the epidemic in Switzerland was reached at 7782 cases per week. This took place on March 26. Since then the number of new cases per week has steadily decreased to 817 on May 5.
Figure 2
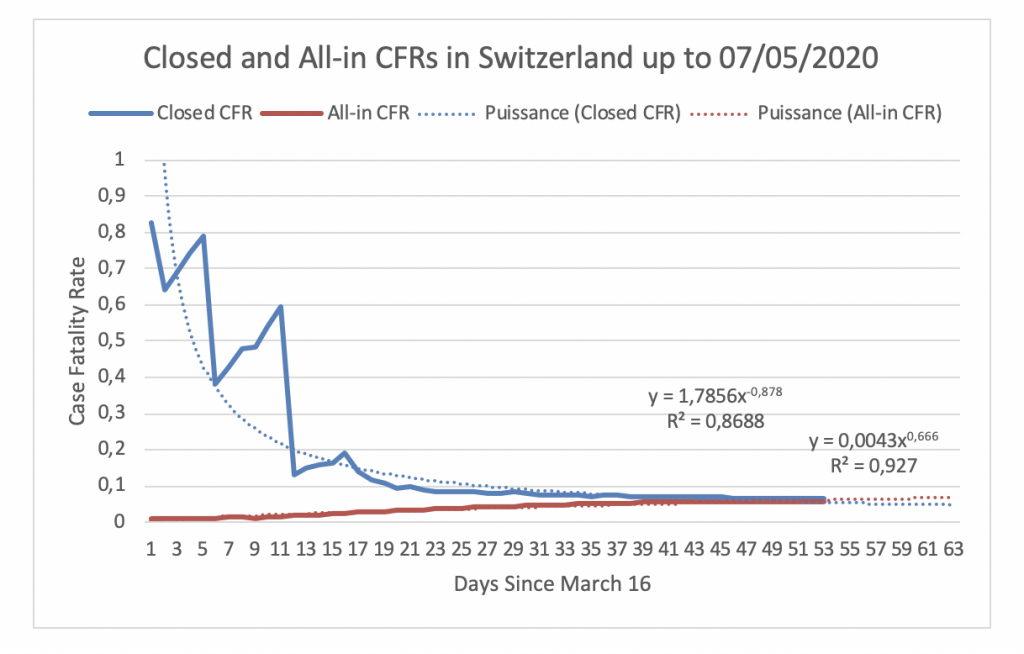
Figure 2 displays the evolution of the closed case fatality rate (denoted Closed CFR and depicted in blue) and the all-in case fatality rate (denoted All-in CFR and depicted in red) since March 16, the day the Closed CFR in Switzerland attained its maximum. The Closed CFR is the ratio of the number of fatalities due to covid-19 to the number of closedcases of covid-19, that is, Closed CFR = Fatalities/(Fatalities + Recovered). The All-in CFR is the ratio of the number of deaths due to covid-19 to the number of confirmed cases of covid-19, that is, All-in CFR = Fatalities/(Fatalities + Recovered + Active). The Closed CFR is always higher than the All-in CFR since closed cases are always lower than confirmed cases. The two CFRs approach each other as the number of active cases goes to zero. At the transition date, the two CFRs are identical.
We see from Figure 2 that the Closed CFR and the All-in CFR in Switzerland are very close to each other. In fact, their values are 6.34% and 5.83%, respectively. The blue dotted curve depicts a power trend that fits the evolution of the Closed CFR and the red dotted line depicts a power trend that fits the evolution of the All-in CFR. When the two trends intercept the closed CFR and the all-in CFR are identical. This happens when the CFR is 5.8%.
Figure 3
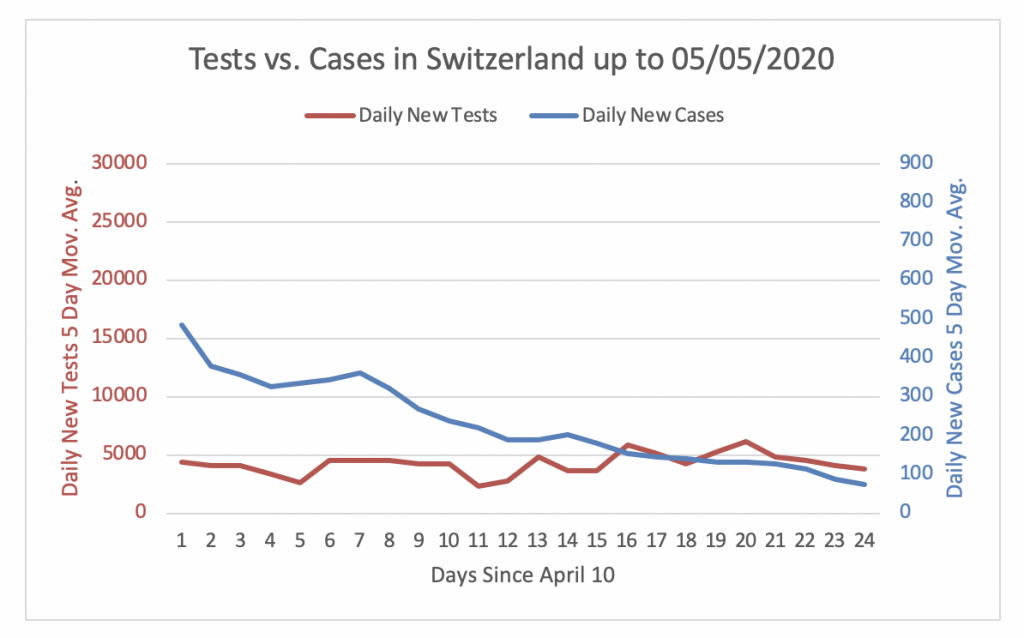
Figure 3 displays the evolution of the daily new tests and daily new cases in Switzerland using a 5 day moving average and starting on April 10. The vertical axis on the left (in red) depicts the daily new tests. The vertical axis on the right (in blue) depicts the daily new cases. The two vertical axes are scaled so that they are comparable. According to Puyeo (2020b): “the experience of countries that controlled the epidemic indicates we should aim for at least 3% of positives, which means you want approximately 33 times more tests than cases.” Following this approach, the vertical axis on the left (tests) is 33 times bigger than the vertical axis on the right (cases). Hence, when the blue line is above the red, not enough tests are being done. In contrast, when the red line is above the blue line, then enough tests are being done. Figure 3 shows that the number of daily new tests in Switzerland has been at around 5000 tests per day during the last 24 days. In contrast, the number of daily new cases has steadily decreased in the past 24 days from more than 500 to less than 100. The number of daily new tests is now 53 times the number of daily new cases. Hence, Switzerland is doing enough testing.
Germany
Figure 4
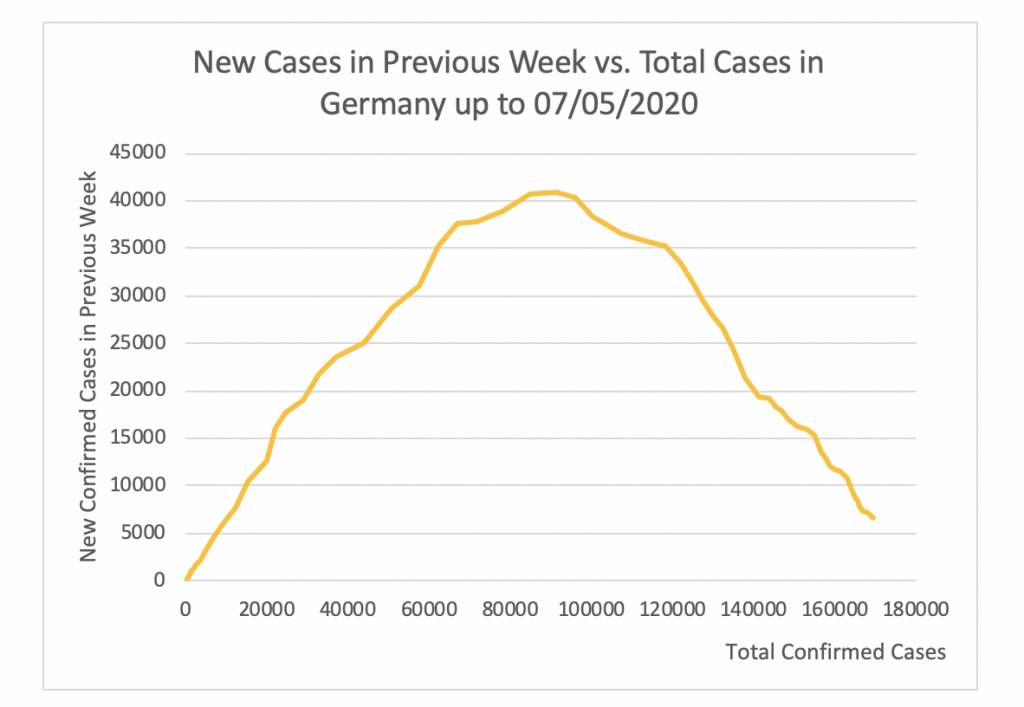
Figure 4 shows that the apex of the epidemic in Germany was attained at 40811 cases per week. This took place on April 3. Since then this number has steadily decreased to 7394 on May 5.
Figure 5
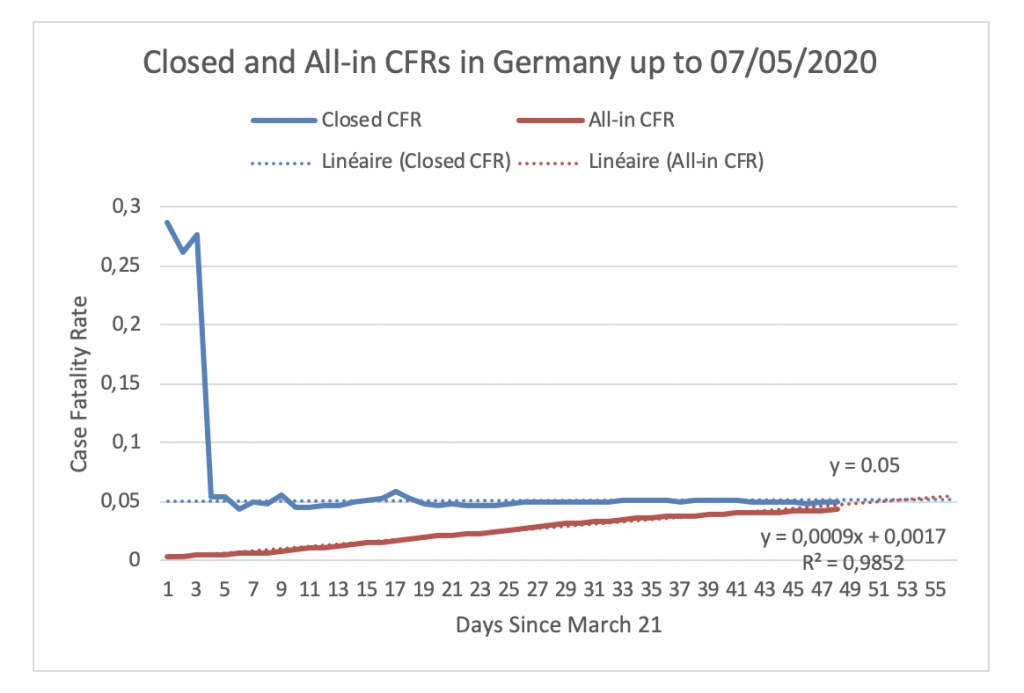
Figure 5 displays the evolution of the Closed CFR and the All-in CFR in Germany since March 21, the day the Closed CFR in Germany attained its maximum. Figure 5 shows that the Closed CFR and All-in CFR are very close. In fact, their values are 5.02% and 4.36%, respectively. If the two CFRs follow their fitted trends, they will intercept at 5.02% on May 14.
Figure 6
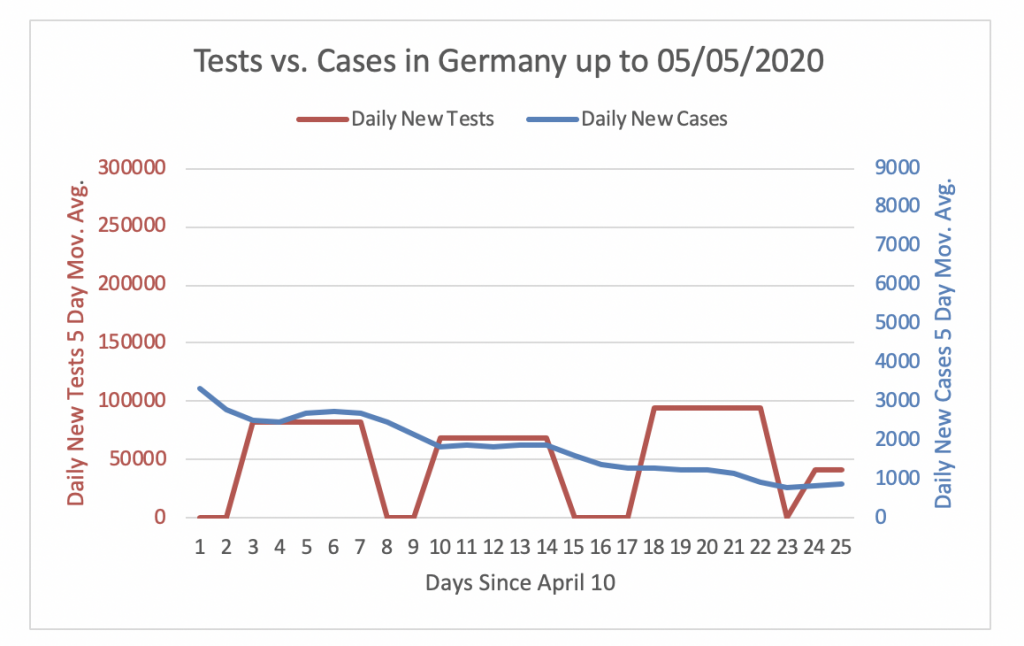
Figure 6 shows that Germany was not performing enough tests to detect cases until April 24. However, since then the daily new tests are adequate to detect cases. The number of daily new tests has been at around 75000 tests per day during the last 24 days. Since the number of daily new cases decreased steadily in the past 24 days, daily new tests are now 47 times higher than daily new cases.
Spain
Figure 13
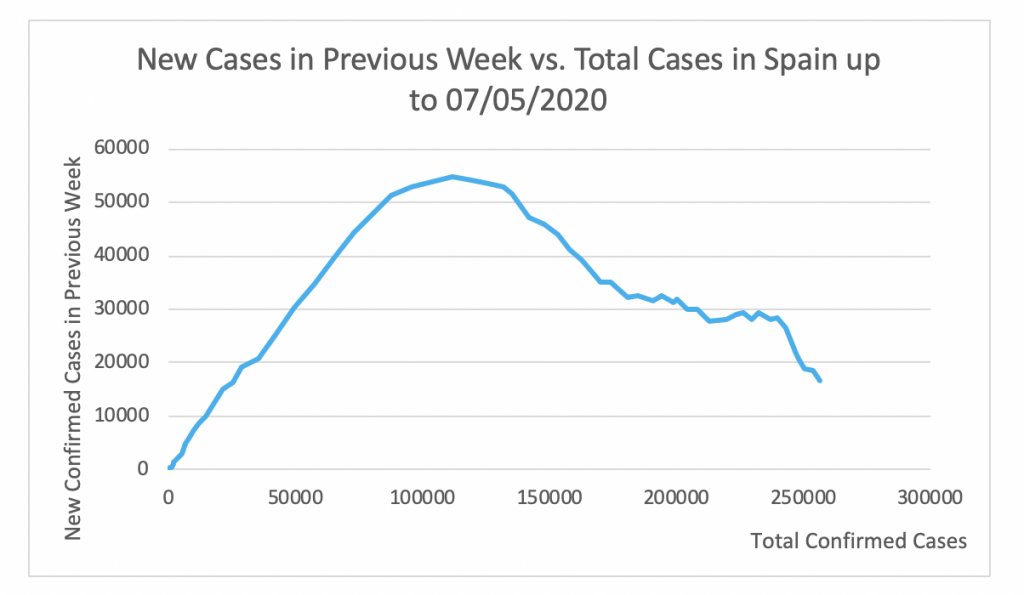
Figure 13 shows that the apex of the epidemic in Spain was attained at 54603 cases per week. This took place on April 2. Since then this number has steadily decreased to 18879 on May 5.
Figure 14
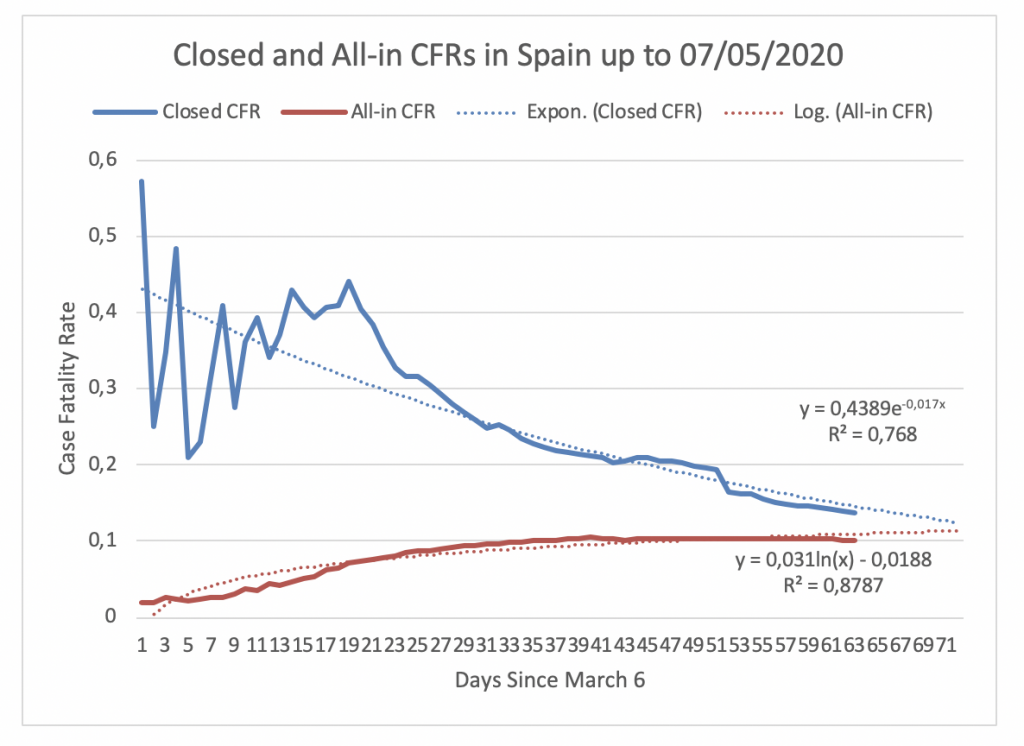
Figure 14 displays the evolution of the Closed CFR and the All-in CFR in Spain since March 6, the day the Closed CFR in Spain attained its maximum. Figure 14 shows that the Closed CFR and All-in CFR are quite close. On May 7, the Closed CFR is 14% and the All-in CFR is 10%. Hence, the gap between the CFRs in Spain is only 4%. If the CFRs follow their respectively fitted trends, they will meet at 11.63% on May 21.
Figure 15
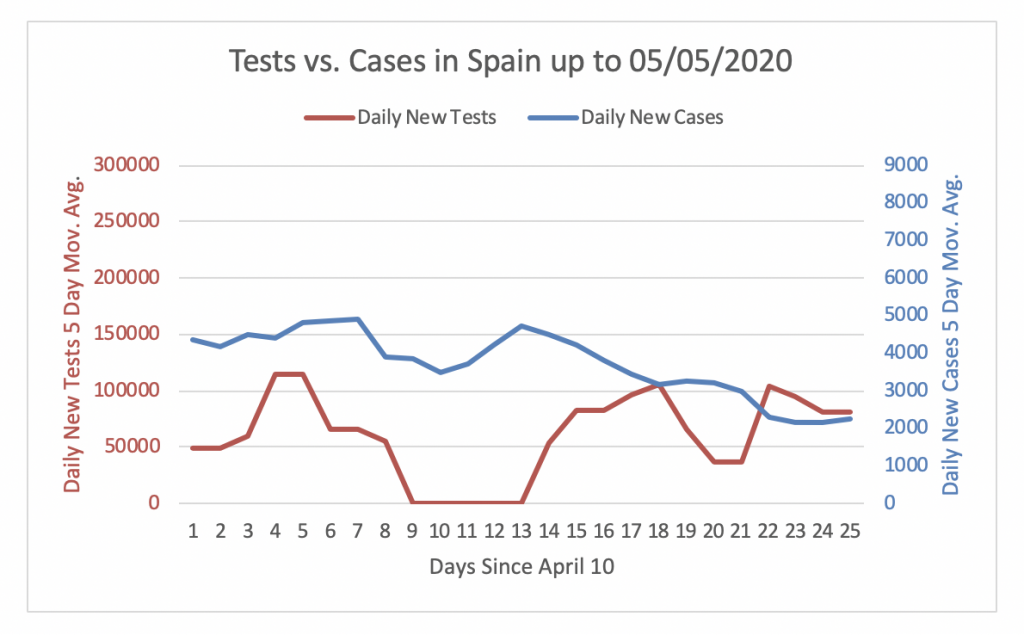
Figure 15 shows that Spain was not performing enough tests to detect cases until the 28th of April. However, in the last few days the daily new tests are adequate to detect cases. The number of daily new tests performed in Spain has been at around 50000 tests per day during the last 24 days. Since the number of daily new cases has been steadily decreasing in the past 24 days, the number of daily new tests is now about 36 times the number of daily new cases.
Portugal
Figure 16
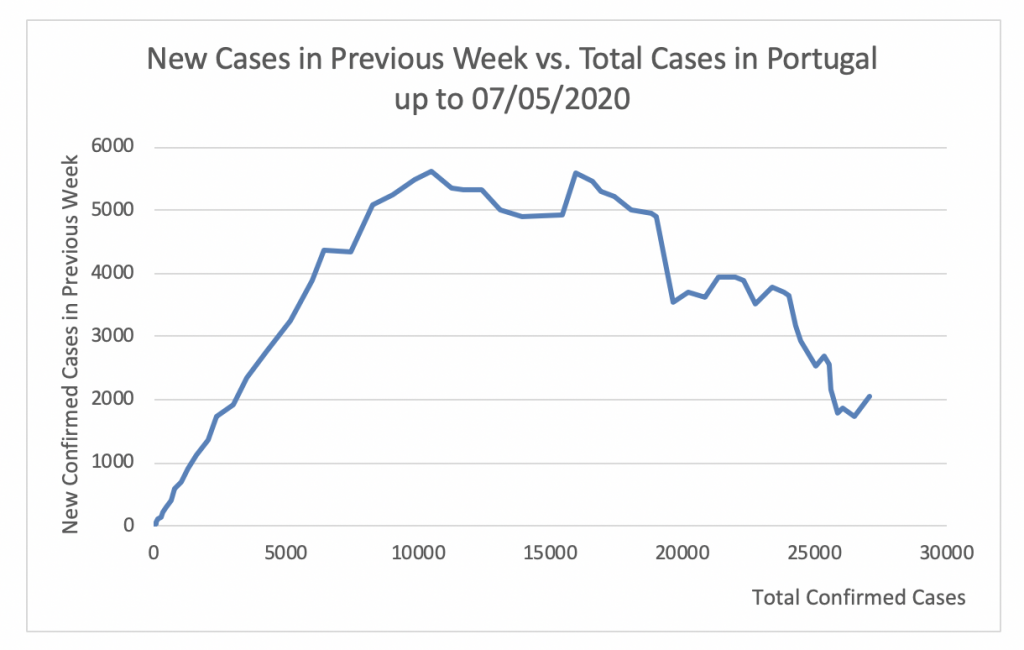
Figure 16 shows that the apex of the epidemic in Portugal was attained at 5681 cases per week. This took place on April 4. Since then this number has steadily decreased to 1861 on May 5.
Figure 17
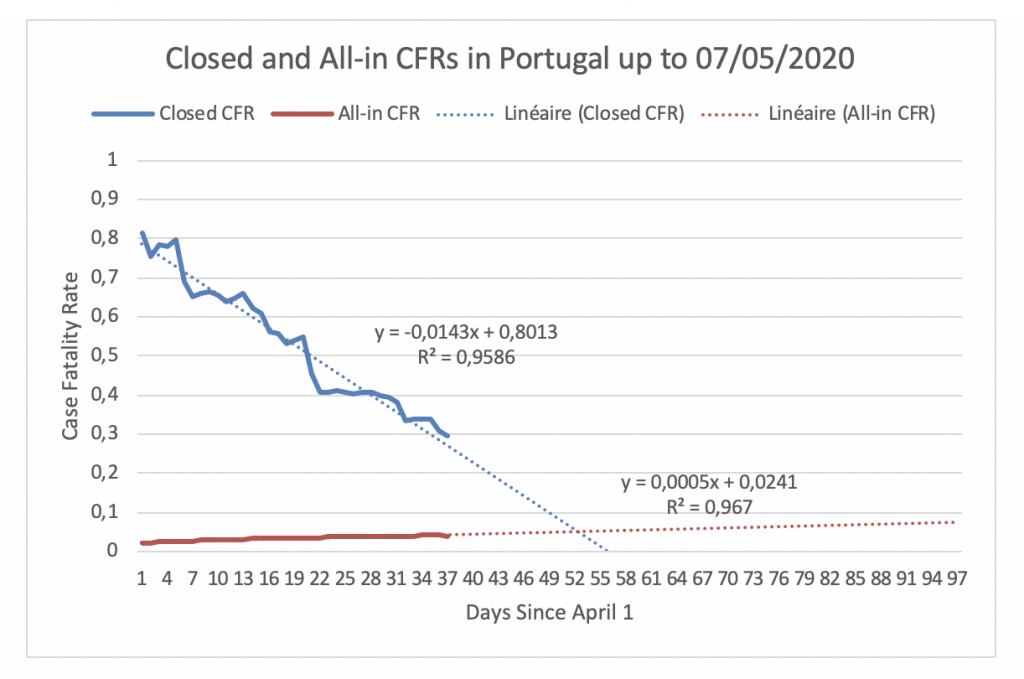
Figure 17 displays the evolution of the Closed CFR and the All-in CFR in Portugal since April 1, the day the Closed CFR in Portugal attained its maximum. On May 7, the Closed CFR is 30% and the All-in CFR is 4%. Hence, the gap between the CFRs in Portugal is 26%. If the CFRs follow their respectively fitted trends, they will meet at 5.04% on May 22.
Figure 18
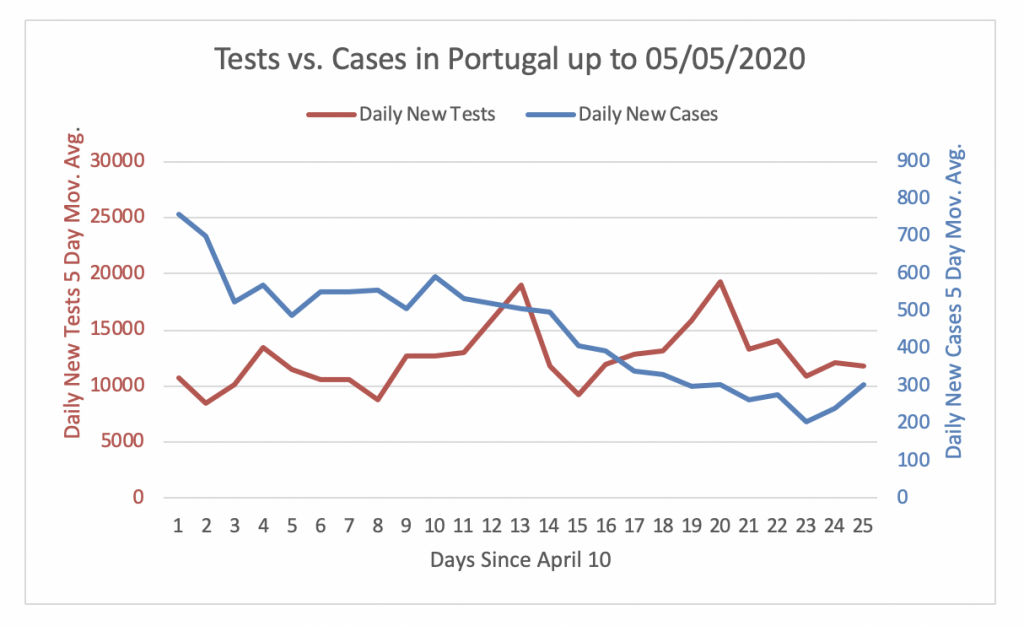
Figure 18 shows that Portugal was not performing enough tests to detect cases until April 22. However, since then the daily new tests are, on average, adequate to detect cases. The number of daily new tests performed in Portugal has been at around 12500 tests per day during the last 24 days. Since the number of daily new cases has steadily decreased in the past 24 days, the number of daily new tests is now 39 times the number of daily new cases.
Italy
Figure 7
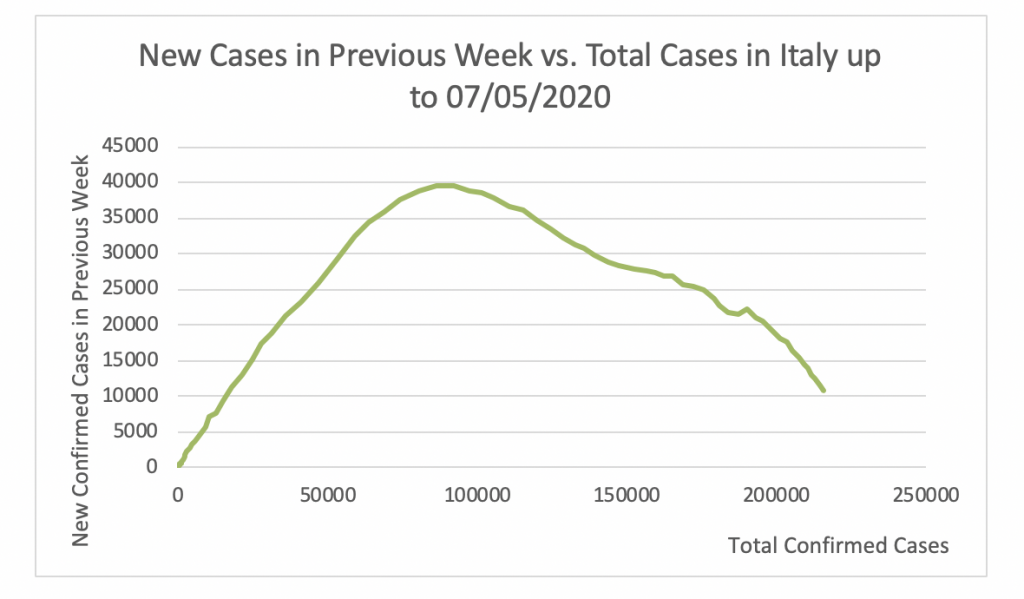
Figure 7 shows that the apex of the epidemic in Italy was attained at 39777 cases per week. This took place on March 28. Since then this number has steadily decreased to 12524 on May 5. This number of cases per week is still relatively high. It is not easy to perform testing, contact tracing, and isolation with 12524 new cases per week.
Figure 8

Figure 8 displays the evolution of the Closed CFR and the All-in CFR in Italy since February 24, the day the Closed CFR in Italy attained its maximum. Figure 8 shows that the Closed CFR and All-in CFR have not yet converged. On May 7, the Closed CFR is 24% and the All-in CFR is 14%. Hence, the gap between the CFRs in Italy is 10%. If the CFRs follow their respective fitted trends, they will intercept at 19.31% on June 11.
Figure 9
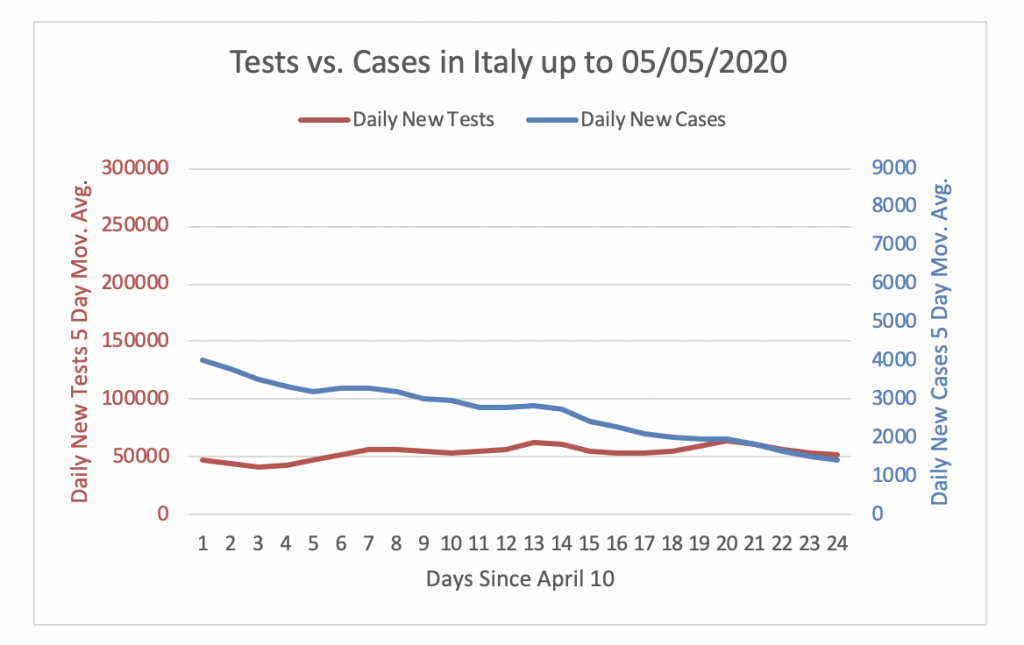
Figure 9 shows that Italy was not performing enough tests to detect cases until the 30th of April. However, in the last few days the daily new tests are adequate to detect cases. The number of daily new tests performed in Italy has been at around 50000 tests per day during the last 24 days. Since the number of daily new cases has been steadily decreasing in the past 24 days, the number of daily new tests is now 37 times the number of daily new cases. Hence, Italy is doing enough testing.
France
Figure 10
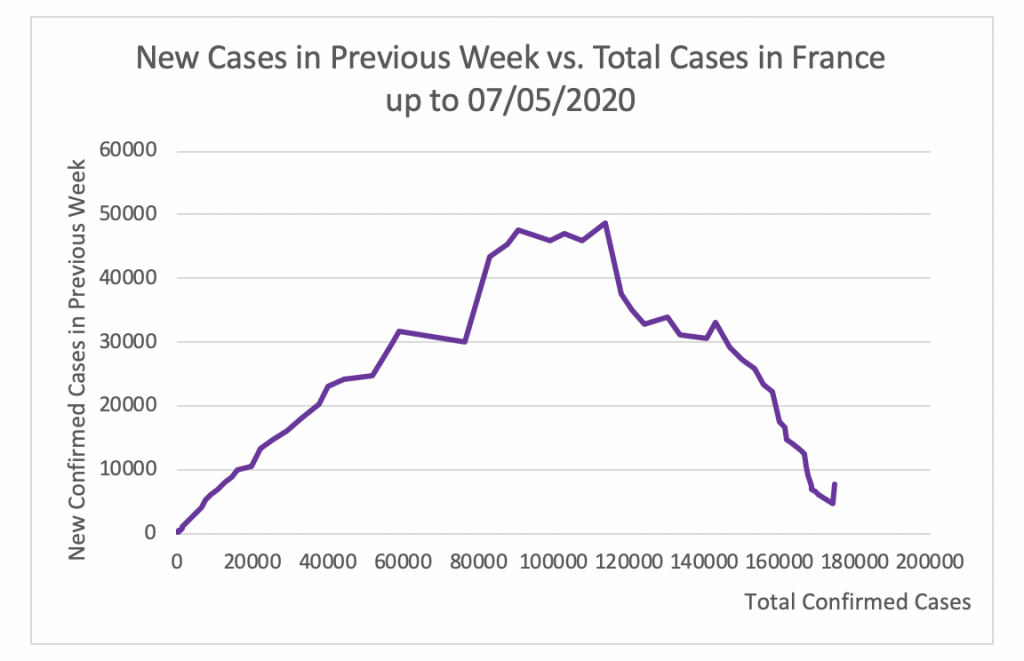
Figure 10 shows that the apex of the epidemic in France was attained at 48591 cases per week. This took place on April 11. Since then this number has steadily decreased to 6189 on May 5.
Figure 11
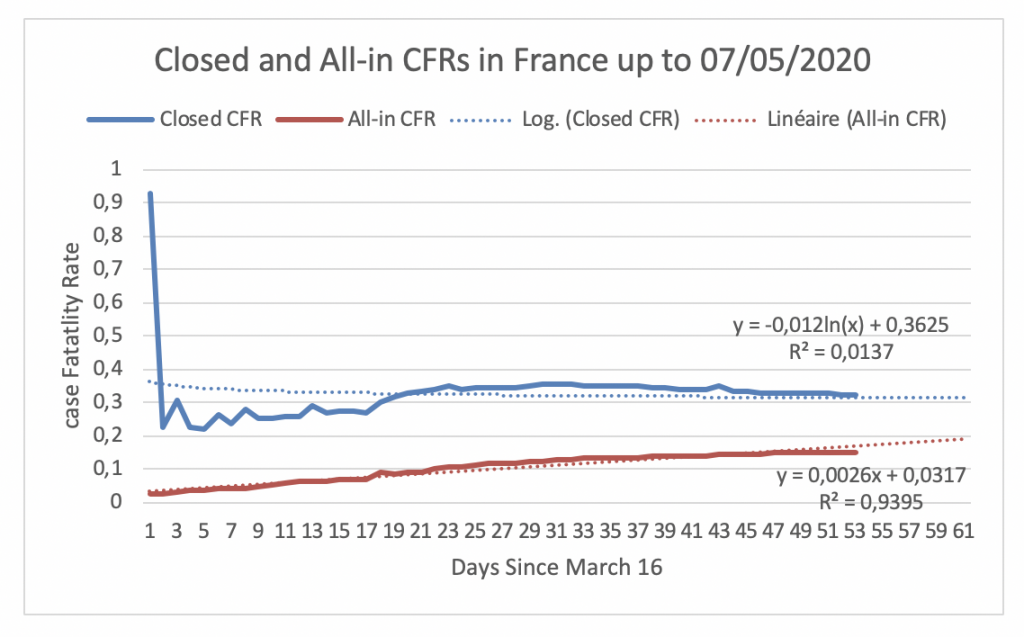
Figure 11 displays the evolution of the Closed CFR and the All-in CFR in France since March 16, the day the Closed CFR in France attained its maximum. Figure 11 shows that the Closed CFR and All-in CFR have not yet converged. On May 7, the Closed CFR is 32% and the All-in CFR is 14%. If the two CFRs follow their respectively fitted trends, they will meet at 30.36% on June 29.
Figure 12
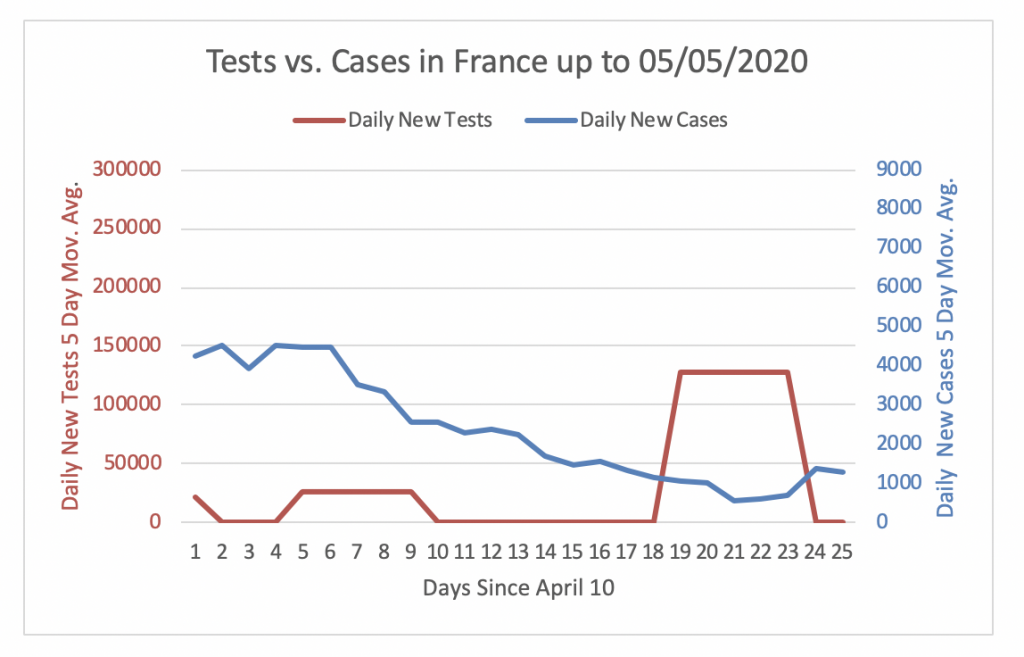
Figure 6 shows that France was not performing enough tests to detect cases until April 28. However, since then the daily new tests are, on average, adequate to detect cases. The number of daily new tests performed in France has oscillated been 0 and close to 12750 tests per day during the last 24 days. Since the number of daily new cases has steadily decreased in the past 24 days, the number of daily new tests is in the last week, on average, 97 times the number of daily new cases.
United Kingdom
Figure 19
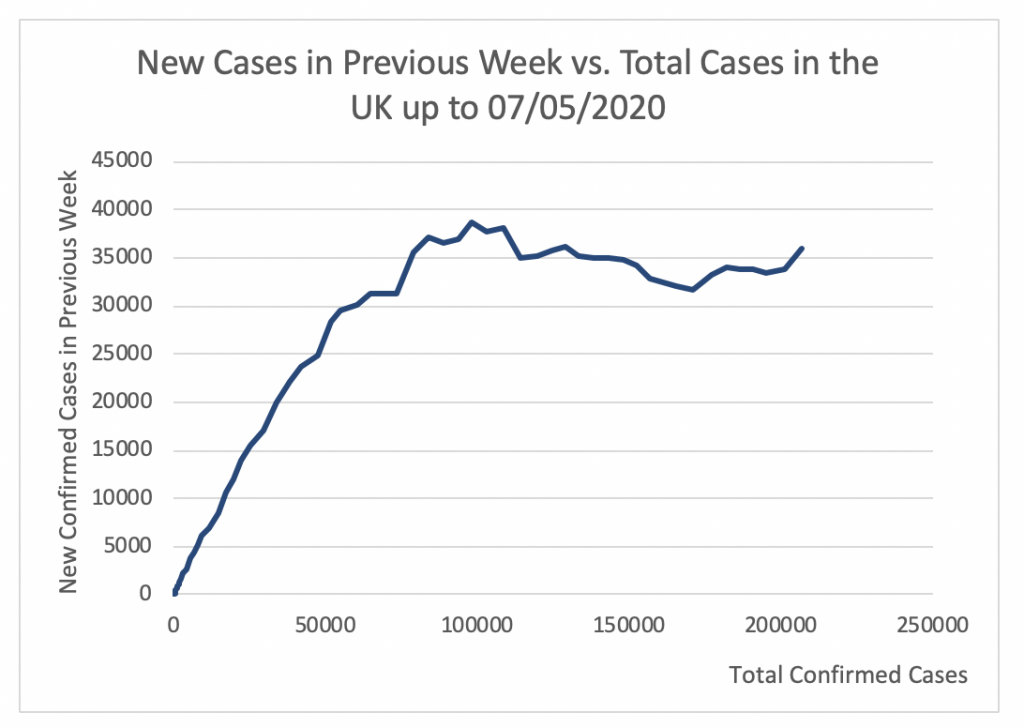
Figure 19 shows that the apex of the epidemic in the UK was attained at 38631 cases per week. This took place on April 15. Since then this number has slightly decreased to 33435 on May 5. This number of cases per week is very high. It is not possible to perform testing, contact tracing, and isolation with 33435 new cases per week.
Figure 20
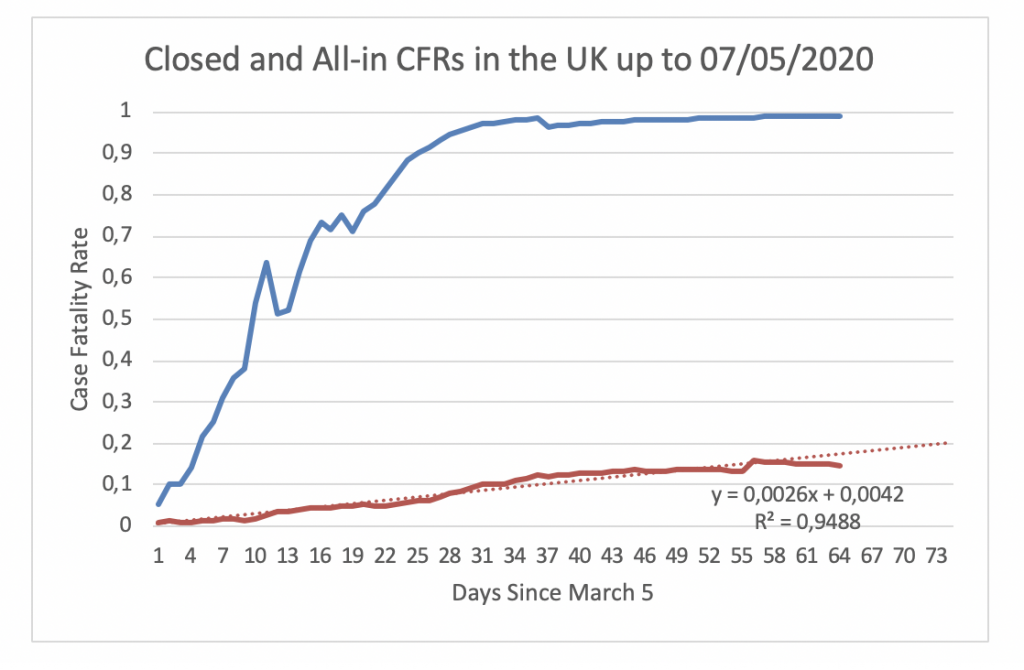
Figure 20 displays the evolution of the Closed CFR and the All-in CFR in the UK since March 5. The dataset used in this article does not contain the number of recovered cases in the UK hence the evolution of the Closed CFR is monotonically increasing. On May 7, the All-in CFR is 15%.
Figure 21
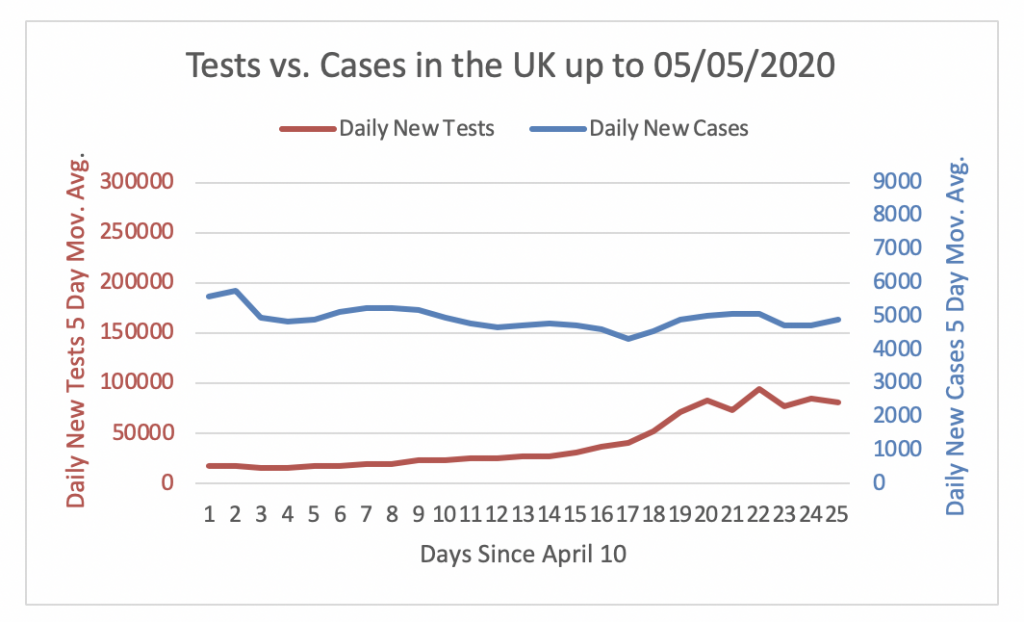
Figure 21 shows that the UK is not performing enough tests to detect cases. On May 5, the number of daily new tests is only about 16.5 times the number of daily new cases. With about 4891 cases on May 5 the UK would need to perform 163300 tests to reach a 3% share of positive tests. However, the UK only performed 80927 tests on May 5. Hence, the gap in testing is 82373 = 163300 – 80927.
Sweden
Figure 22
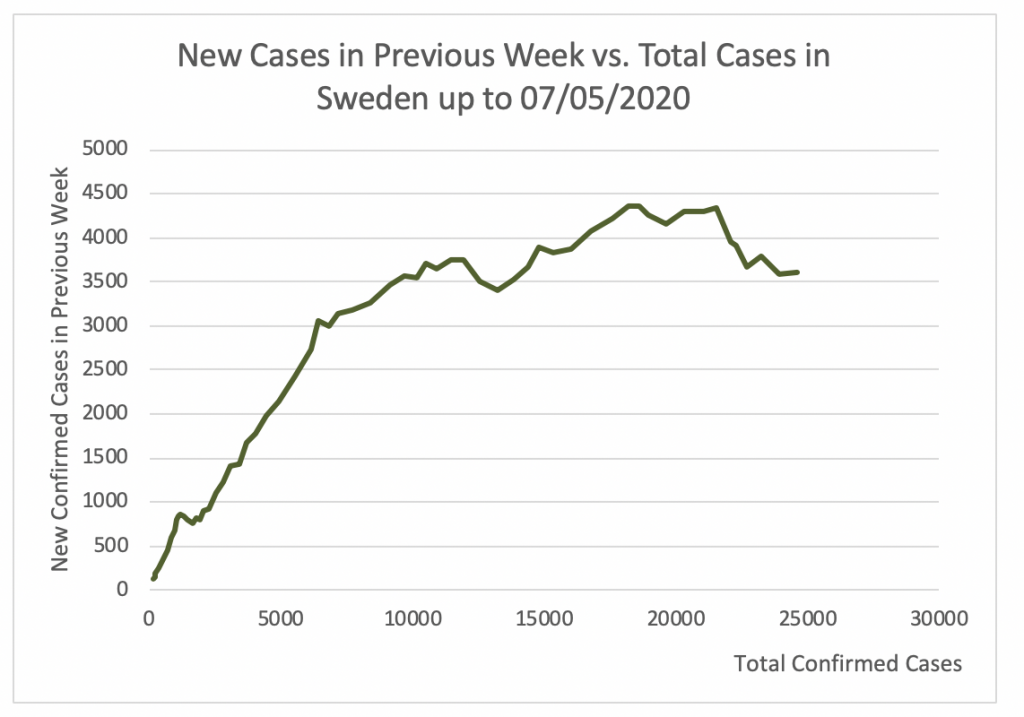
Figure 22 shows that the apex of the epidemic in Sweden was attained at 4355 cases per week. This took place on April 26. Since then this number has decreased to 3616 on May 5.
Figure 23
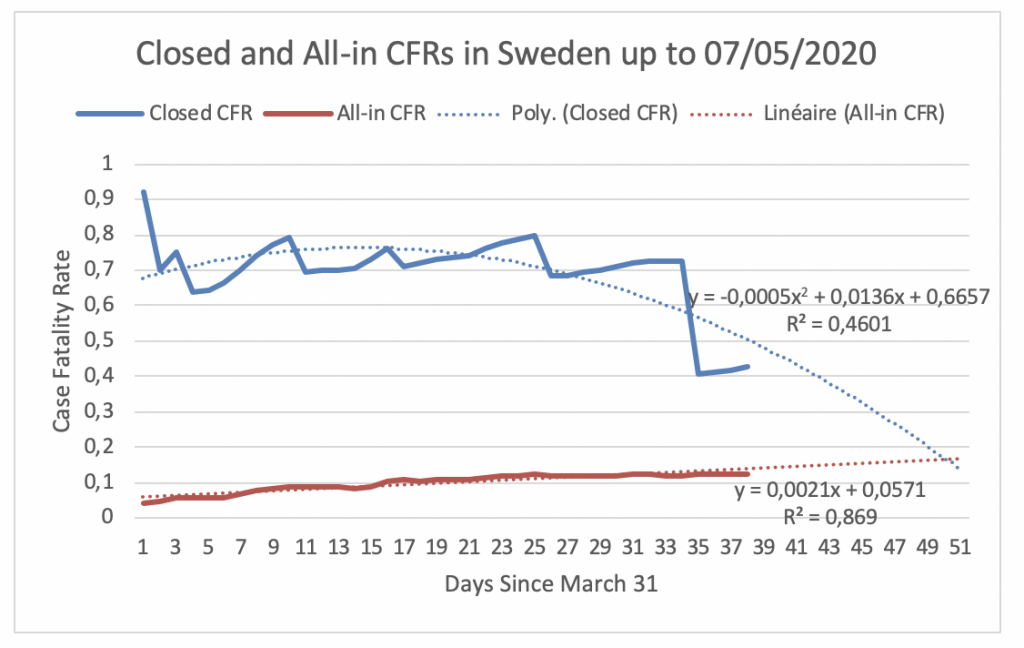
Figure 23 displays the evolution of the Closed CFR and the All-in CFR in Sweden since March 31, the day the Closed CFR in Sweden attained its maximum. Figure 23 shows that the Closed CFR and All-in CFR have not yet converged. On May 7, the Closed CFR is 43% and the All-in CFR is 12%. Hence, the gap between the CFRs in Sweden is 31%. If the CFRs follow their respectively fitted trends, they will meet at 15.84% on May 15.
Figure 24
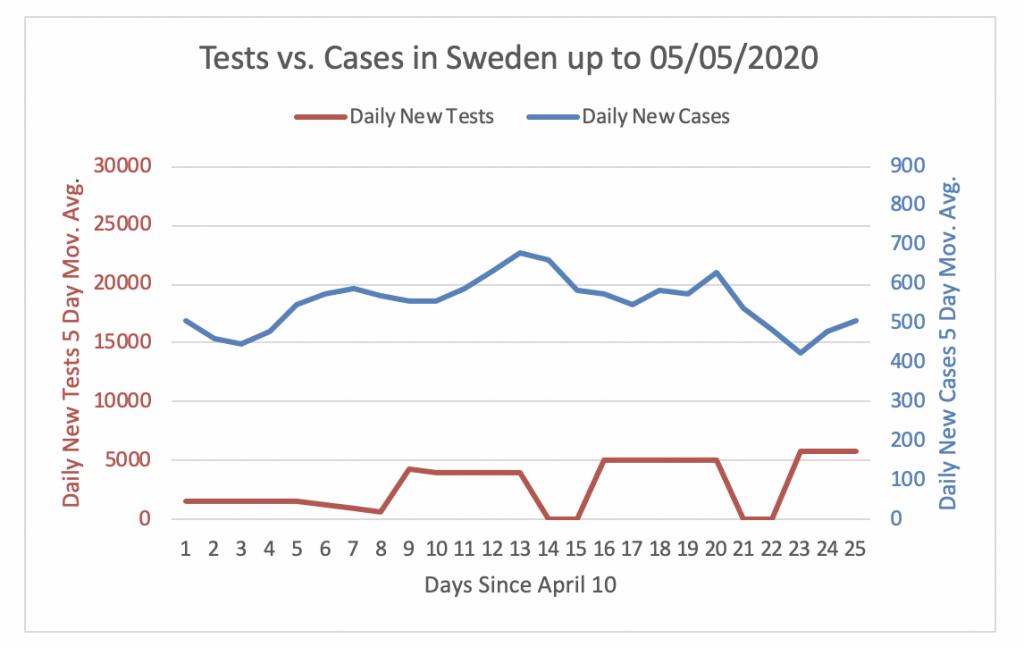
Figure 24 shows that Sweden is not performing enough tests to detect cases. On May 5, the number of daily new tests is only about 11.5 times the number of daily new cases. With about 508 cases on May 5 Sweden would need to perform about 17000 tests to reach a 3% share of positive tests. However, Sweden only performed 5800 tests on May 5. Hence, the gap in testing is 11200 = 17000 – 5800.
United States
Figure 25
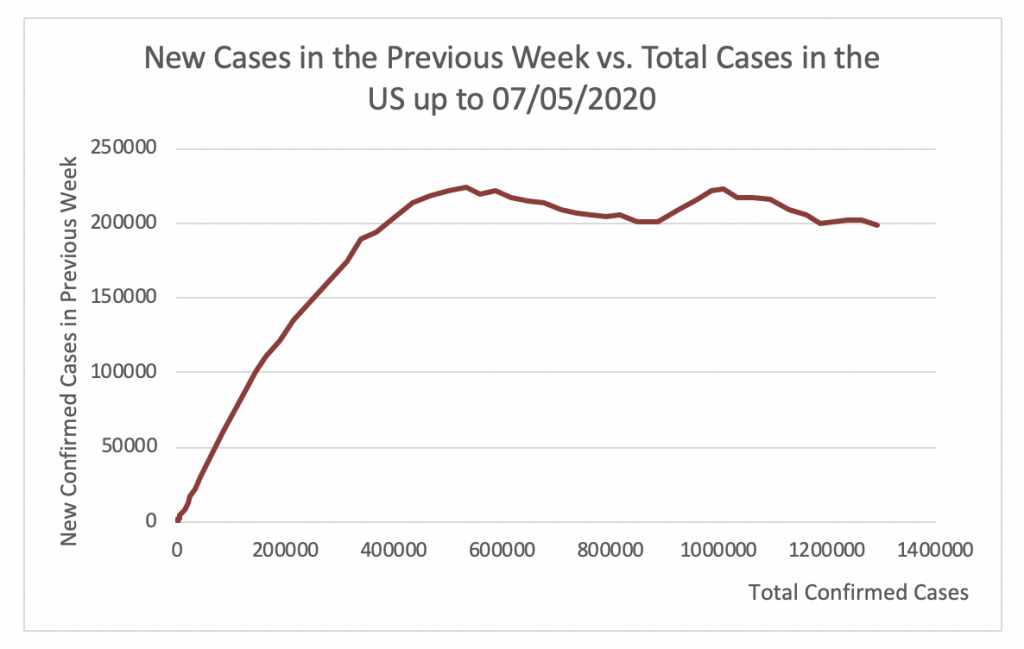
Figure 25 shows that the apex of the epidemic in the US was attained at 222524 cases per week. This took place on April 28. Since then this number has slightly decreased to 202479 on May 5. This number of cases per week is very high. It is not possible to perform testing, contact tracing, and isolation with 202479 new cases per week.
Figure 26

Figure 26 displays the evolution of the Closed CFR and the All-in CFR in the US since March 13, the day the Closed CFR in the US attained its maximum. Figure 26 shows that the Closed CFR and the All-in CFR have not yet converged. On May 7, the Closed CFR is 26% and the All-in CFR is 6%. Hence, the gap between the CFRs in the US is 20%. If the CFRs follow their respective fitted trends, they will meet at 11.73% on June 22.
Figure 27
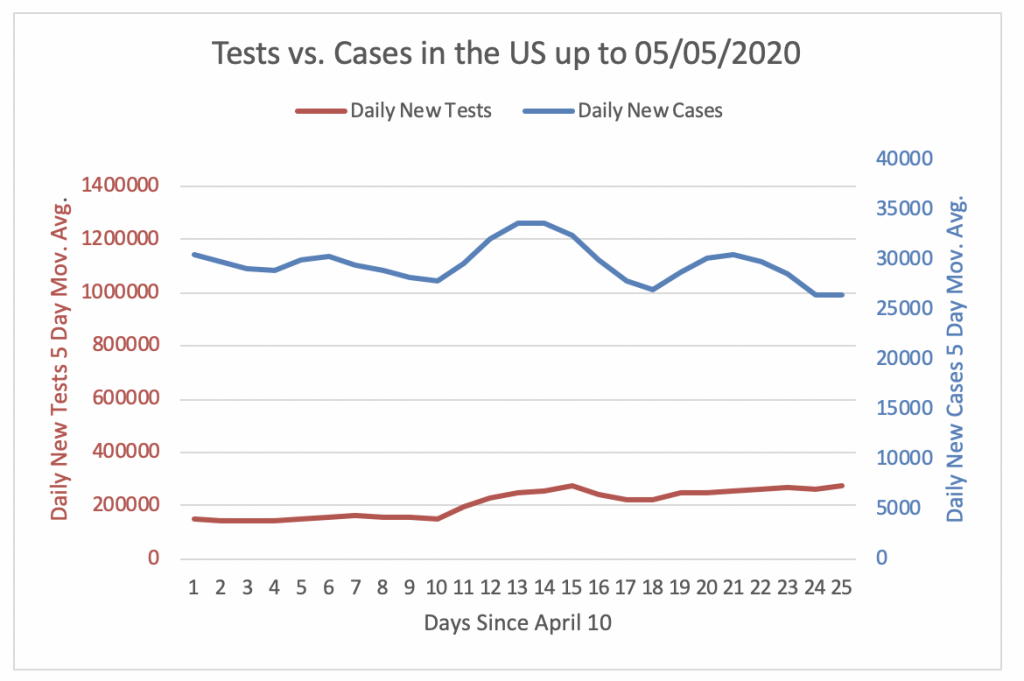
Figure 27 shows that the US is not performing enough tests to detect cases. On May 5, the number of daily new tests is only about 10 times the number of daily new cases. With about 27000 cases on May 5 the US would need to perform 879000 tests to reach a 3% share of positive tests. However, the US only performed 273286 tests on May 5. Hence, the gap in testing is 605714=879000 – 273286.
Conclusion
As the epidemic advances, the decisions and actions of governments become increasingly important for the outcomes of each country.
At the start of the epidemic, the main decision was whether to impose a lockdown, when to start the lockdown, and how harsh this would be. At that time, government of the UK, Sweden and the US entertained the idea of following a risky natural herd immunity strategy (Santos-Pinto and Mata, 2020) and took longer to impose lockdowns than other countries. This delay contributed to relatively higher numbers of cases and fatalities in these countries. As Wren-Lewis (2020) writes: “The longer a country takes to go into lockdown, the longer the lockdown must last to bring cases down to a level that [test, trace and isolate] can manage. Herd immunity will be remembered as one of the most costly mistakes a UK government ever made in peacetime.”
Currently, the main decision governments need to make is when to end the lockdown (when to drop “the hammer”) and move to testing, tracing and isolation (when to enter “the dance”). Countries should satisfy two criteria to be able to dance. First, they should have a relatively low number of daily new cases. Second, they should have in place adequate testing and contact-tracing capabilities relative to the number of daily new cases.
This article shows that Switzerland and Germany are ready to dance. Spain, Portugal, Italy, and France still need to prolong their lockdowns a bit further but already have adequate testing capabilities. Finally, the UK, Sweden, and the US should prolong their lockdowns for longer so that they bring down the number of daily new cases and develop adequate testing capabilities.
Puyeo, Thomas (2020a). “The Hammer and the Dance,” Medium, March 10, 2020.
Puyeo, Thomas (2020b). “Coronavirus: How to Do Testing and Contact Tracing,” Medium, April 28, 2020.
Santos-Pinto, Luis, and José Mata (2020). “The Problems with the ‘Natural’ Herd Immunity Solution to the Covid-19 Epidemic,” University of Lausanne, VIRAL.
Wren-Lewis, Simon (2020). “We Can’t Restart Britain’s Economy until We Get Coronavirus under Control,” The Guardian, May 11, 2020.
Luís Santos-Pinto est professeur d’économie à la Faculté des HEC de l’Université de Lausanne.
Son principal domaine de recherche est la théorie microéconomique appliquée. Il étudie les liens entre l’information, la cognition, le jugement et le comportement économique. Il s’intéresse aux implications des biais comportementaux comme l’excès de confiance et l’optimisme en termes de prise de décision individuelle, la conception des incitations dans les organisations, les résultats du marché et le bien-être. Il utilise des expériences en laboratoire et sur le terrain pour étudier l’existence et les conséquences de ces biais sur les décisions économiques.
Ses recherches couvrent les domaines de la théorie microéconomique appliquée, de l’économie comportementale et expérimentale ainsi que du travail.